from Bio import Entrez
import matplotlib.pyplot as pltA Python recipe for ploting timeline for PubMed searches.
PubMed is a widely used database for scholarly articles in life sciences. It has options to perform simple keyword search as well as features to create complex logical queries. For instance, we can search for a particular keyword and (logical AND) limit the results based on date of publication. The PubMed portal at NCBI also has a nice widget to see the timeline of the publications for a given query. There is an option to download a csv file of year-wise publication which can be used in any graphing software to create customized illustration.
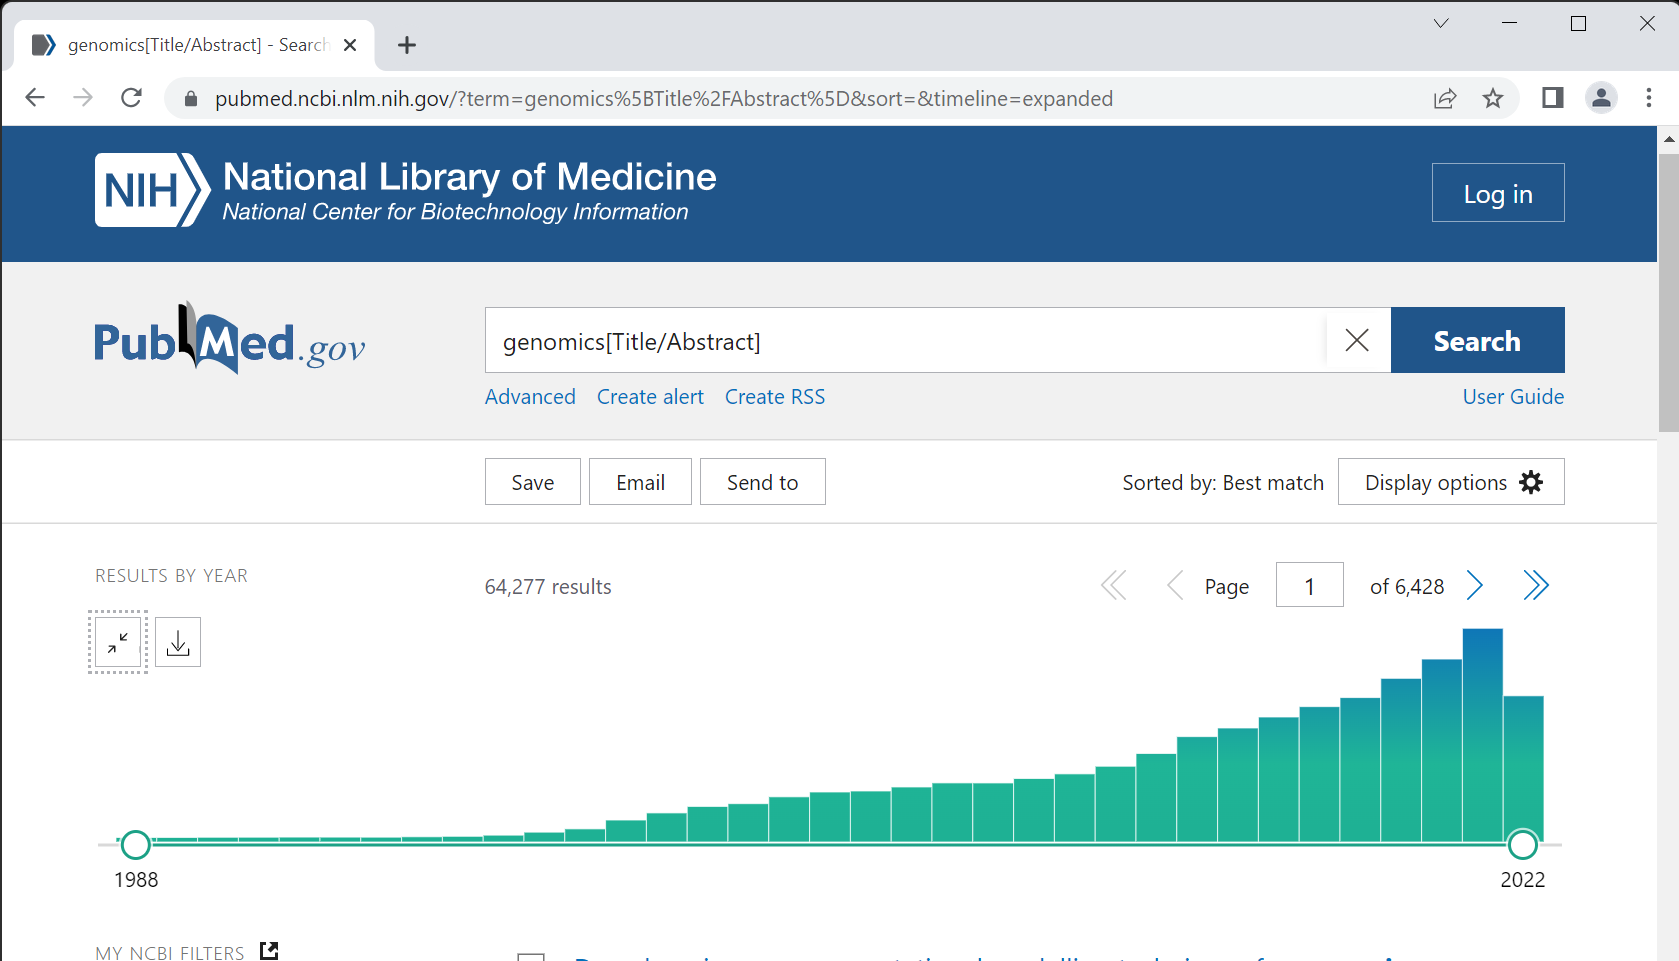
However, there is one shortcoming of the timeline widget; it can only provide timeline for one query at a time. So to have timeline for multiple queries we need to download multiple csv files. Here, using Biopython library we’ll see how to create a time series graph for number of publications using multiple queries. The Biopython library has Entrez module that acts as an interface for the NCBI Entrez database system, which provides access to multiple databases including PubMed. We’ll first import the required libraries.
Next to search PubMed, Entrez.search function would be used with three keyword arguments – db (the database to search), term (pubmed search term), and the retmode (output format). This function return an object that we can read with Entrez.read function to get the search results as a dictionary.
The term argument takes a string which is a valid pubmed query. We can use logical operators within this string.
Note, to use NCBI Entrez programmatically, the user must specify their email id.
Entrez.email = 'test@test.com' #change email id
pubs_genomics = Entrez.esearch(db="pubmed", term="genomics[Title/Abstract]", retmode="xml")
pubs_genomics_dict = Entrez.read(pubs_genomics)
print(pubs_genomics_dict)
{'Count': '64192', 'RetMax': '20', 'RetStart': '0', 'IdList': ['36041373', '36041271', '36040906', '36040446', '36040445', '36040373', '36040313', '36040303', '36040228', '36040103', '36040076', '36040013', '36039580', '36039526', '36039299', '36039293', '36038949', '36038778', '36038144', '36038055'], 'TranslationSet': [], 'TranslationStack': [{'Term': 'genomics[Title/Abstract]', 'Field': 'Title/Abstract', 'Count': '64192', 'Explode': 'N'}, 'GROUP'], 'QueryTranslation': 'genomics[Title/Abstract]'}As shown above, the output dictionary has a key ‘Count’ that stores total number of publications. The ‘RetMax’ shown number of pubmedIDs to retrive. The retrived ids are stored as a list in ‘IdList’.For our assignment we need pubs_genomics_dict['Count'].
We’ll repeat this search with one modification in the term. A year would be added for the “Date of Publication” [DP]. Notice the output dictionary has counts for each of the two sub-queries.
pubs_genomics = Entrez.esearch(db="pubmed", term="genomics[Title/Abstract] AND 2022[DP]", retmode="xml")
pubs_genomics_dict = Entrez.read(pubs_genomics)
print(pubs_genomics_dict)
{'Count': '5013', 'RetMax': '20', 'RetStart': '0', 'IdList': ['36041373', '36041271', '36040906', '36040446', '36040445', '36040373', '36040313', '36040303', '36040228', '36040103', '36040076', '36040013', '36039580', '36039526', '36039299', '36039293', '36038949', '36038778', '36038144', '36038055'], 'TranslationSet': [], 'TranslationStack': [{'Term': 'genomics[Title/Abstract]', 'Field': 'Title/Abstract', 'Count': '64192', 'Explode': 'N'}, {'Term': '2022[DP]', 'Field': 'DP', 'Count': '1191851', 'Explode': 'N'}, 'AND'], 'QueryTranslation': 'genomics[Title/Abstract] AND 2022[DP]'}Next, to generate timeline we need to repeat this search for different years. Lets write a for loop.
yrStart = 2020
yrEnd = 2022
count_out = {}
for ctr in range(yrStart,yrEnd+1):
    search_term = "genomics[Title/Abstract]"+" AND "+str(ctr)+"[DP]"
    t1 = Entrez.esearch(db="pubmed", term=search_term, retmode="xml")
    t1_dict = Entrez.read(t1)
    count_out[ctr] = t1_dict["Count"]
print(count_out)
{2020: '6324', 2021: '7418', 2022: '5013'}Defining the search and plot functions
We now have all the ingredients to make a timeline plot. We’ll define two functions that perform the following tasks: - create two dictionaries of PubMed search results for two different queries given a time range - plot the results using the two dictionaries above.
The run time for the first function would depend on the time range given. Expectedly, the search would take a longer time if larger time range is given.
def getTimeline(pubTerm1, pubTerm2, yrStart, yrEnd):
    '''This function takes four arguments:
    First search term
    Second search term
    Start year
    End year
    It return a list having two dictionaries'''
    counts = [dict(),dict()]
    for ind,t in enumerate([pubTerm1,pubTerm2]):
        print("Searching PubMed for", t)
        for ctr in range(yrStart,yrEnd+1):
            search_term = t+" AND "+str(ctr)+"[DP]"
            t1 = Entrez.esearch(db="pubmed", term=search_term, retmode="xml")
            t1_rec = Entrez.read(t1)
            counts[ind][ctr]=t1_rec["Count"]
    return counts
def plotTimeline(d_list, *args):
'''This function creates a bar plot using a list of two dictionaries.
The args are used to specify plot legends.'''
plt.bar([int(x)-0.2 for x in d_list[0].keys()], \
[int(y) for y in d_list[0].values()], 0.4)
plt.bar([int(x)+0.2 for x in d_list[1].keys()], \
[int(y) for y in d_list[1].values()], 0.4, color="C0", alpha=0.6)
plt.legend(args, frameon=False, loc=6)
plt.xlabel("Year")
plt.ylabel("Number of Publications")
plt.title("PubMed Publications from 2000 - 2022")
plt.box(False)
plt.tick_params(left=False)
plt.grid(axis="y", linestyle="--", linewidth=0.25)
plt.show()
returnout_list = getTimeline("genomics[Title/Abstract]",\
"proteomics[Title/Abstract]", \
2000,2022)
plotTimeline(out_list,"Genomics", "Proteomics")Searching PubMed for genomics[Title/Abstract]
Searching PubMed for proteomics[Title/Abstract]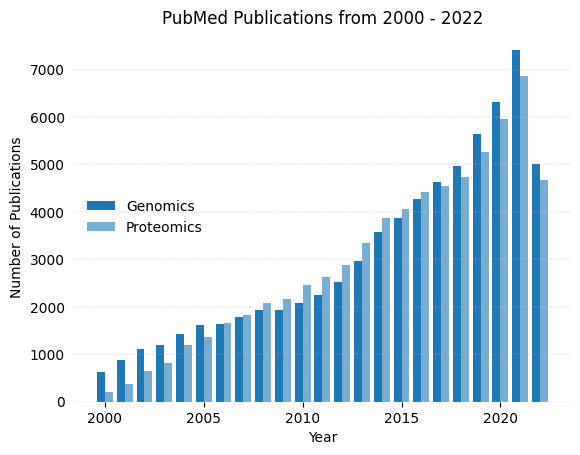
Adding search terms
The above code can be modified to plot timeline for three search terms as shown below.
Searching PubMed for genomics[Title/Abstract]
Searching PubMed for proteomics[Title/Abstract]
Searching PubMed for metabolomics[Title/Abstract]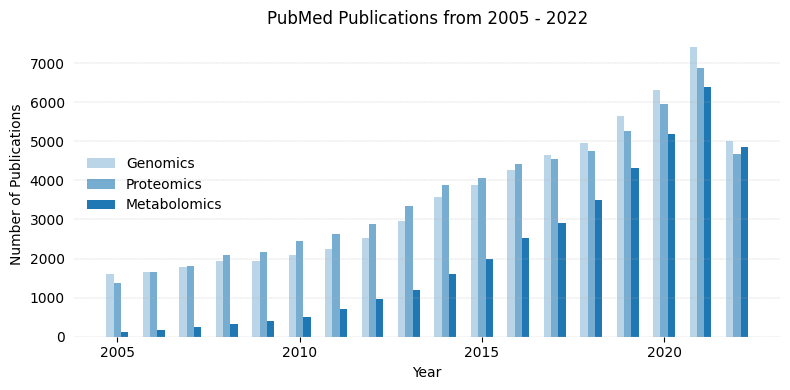
Show Code
def getTimeline3(pubTerm1, pubTerm2, pubTerm3, yrStart, yrEnd):
    counts = [dict(),dict(),dict()]
    for ind,t in enumerate([pubTerm1,pubTerm2,pubTerm3]):
        print("Searching PubMed for", t)
        for ctr in range(yrStart,yrEnd+1):
            search_term = t+" AND "+str(ctr)+"[DP]"
            t1 = Entrez.esearch(db="pubmed", term=search_term, retmode="xml")
            t1_rec = Entrez.read(t1)
            counts[ind][ctr]=t1_rec["Count"]
    return counts
def plotTimeline3(d_list, *args):
    '''This function creates a bar plot using a list of two dictionaries.
    The args are used to specify plot legends.'''
    fig, ax = plt.subplots(figsize=(8,4))
    plt.bar([int(x)-0.2 for x in d_list[0].keys()], \
        [int(y) for y in d_list[0].values()], 0.2, alpha=0.3)
    plt.bar([int(x) for x in d_list[1].keys()], \
        [int(y) for y in d_list[1].values()], 0.2, color="C0", alpha=0.6)
    plt.bar([int(x)+0.2 for x in d_list[2].keys()], \
        [int(y) for y in d_list[2].values()], 0.2, color="C0")#, alpha=0.4)
    plt.legend(args, frameon=False, loc=6)
    plt.xlabel("Year")
    plt.ylabel("Number of Publications")
    plt.title("PubMed Publications from 2005 - 2022")
    plt.box(False)
    plt.tick_params(left=False)
    plt.xticks(ticks=[2005. , 2010. , 2015. , 2020.],\
    labels=["2005", "2010","2015","2020"])
    plt.grid(axis="y", linestyle="--", linewidth=0.25)
    plt.tight_layout()
    plt.show()
    return
out_list3 = getTimeline3("genomics[Title/Abstract]",\
                       "proteomics[Title/Abstract]", \
                       "metabolomics[Title/Abstract]", \
                       2005,2022)
plotTimeline3(out_list3,"Genomics", "Proteomics", "Metabolomics")